Archive
Failover Cluster from Command Prompt
Here we will see how to check Cluster,Cluster Resources,Nodes etc from Command Prompt and also how to failover to the available nodes.
It will help you check cluster resources when the Cluster GUI is not able to provide proper information in case Disk Hangs, failover is taking longer then expected etc.

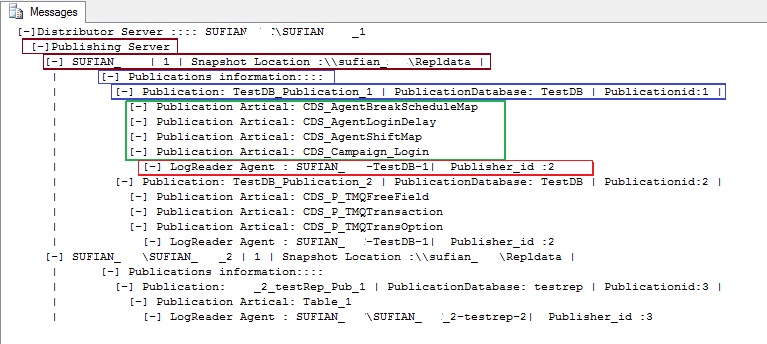
Transactional Replication Information (Publisher–Publication-Articals–LogReader)
I have created a script to get all replication information about Publisher,Publication,Articals and LogReader in a treeview Structure .Like How many publisher withsnapshot location,how many publication are generated from each of the publisher,How many articals are associated with each publication ,Log Reader Agents associated with each publication with LodReader Agent Job information. I will write more about Replication Type,SyncType,Subscription Type etc in my next blog post or in the same one.
Script: Download the script and run the Script at Distribution Database
Run this script if u have SQL Server 2005 or above.
Download : Replication_Info_Script – V3
Download :Replication_Info_Script – V2
Download : Replication_Info_Script

Update : Added Subscription Information

Update : Added Distributor Information

The SKU is invalid on Adding Node to SQL Server Failover Cluster
After creating new SQL Server failover cluster node and try doing a failover you will get the error
ERROR:-
The Action ‘move to node xyz’ didn’t complete. An error occurred moving the clustered service or application ‘SQLClusResourcegroup4’. The operation failed because either the specified cluster node is not the owner of the group or the node is not a possible owner of the group.
Reason:
The fail over node may not be designated as a possible owner for all the resources in the group that you want to failover.
Solution:
Add the node on the passive node as “Add node to SQL Server Failover Cluster”
While doing so you may get the error “The current SKU is invalid”
I was able to work around it by running setup.exe from command prompt and it bypasses this issue.
Run the setup from command prompt
- Run the command prompt “Run as Administrator”
- Code
setup.exe /ACTION=AddNode /INSTANCENAME=”MSSQLSERVER”
/SQLSVCACCOUNT=”CORP\Username” /SQLSVCPASSWORD=”Password”
/AGTSVCACCOUNT=”CORP\Username”, /AGTSVCPASSWORD=”Password”
/INDICATEPROGRESS
SQL Server Index Fragmentation and Its Resolution
It’s really easy to answer the interviewer question “How to know index fragmentation?” and “what you will do to resolve the issue?”
It’s always a situation with Production DBA’s how to find index fragmentation and in case they are lucky enough to find out they are confused its internal fragmentation or external fragmentation. What to do to reduce index fragmentation it should be Index Organize or Rebuild is a big challenge.
DBA don’t put much effort that rebuilding the indexes can be more expensive in an OLTP environment and affect the system inadequately. Fragmentation can cause serious performance issues and it’s vital to understand how it affects the performance.
Fragmentation can cause queries run slower due to more disk IO because of data page splitting
If the table size is too large and you decide to rebuild the index (online or offline), it can be a expensive decision as rebuilding index will make the system more slow while rebuilding of index is in progress.
In SQL Server there are two types of index fragmentation internal fragmentation and external fragmentation.
Internal Fragmentation: Occurs if the percentage of free space in index pages is below 75%.
This doesn’t mean that index which have fill factor or more then 80% doesn’t come in this category.
External Fragmentation: External fragmentation occurs when an index leaf page is not in logical order. When an index is created, the index keys are placed in a logical order on a set of index pages. As new data is inserted into the index, it is possible for the new keys to be inserted in between existing keys. This may cause new index pages to be created to accommodate any existing keys that were moved so that the new keys can be inserted in correct order.
First we will figure out the indexes on tables or on all objects of a database.

SELECT id,indid,dpages,OrigFillFactor,name Ind_Name FROM sys.sysindexes
WHERE id=OBJECT_ID(‘__DROPRO’)
————————————————————————————————
| id | indid | dpages | OrigFillFactor | Ind_Name |
| 518565927 | 1 | 0 | 0 | Colid_Clu |
| 518565927 | 2 | 0 | 0 | NonClustered_CheckFrag |
At the movement there are no records associated with the table. So, there will not be any fragmentation.
![]()
| DECLARE @IndexFrag TABLE
( ObjectName varchar(MAX), ObjectIndex varchar(max), Avg_fragmentation_in_percent decimal, avg_page_space_used_in_percent decimal ) INSERT INTO @IndexFrag ( ObjectName,ObjectIndex,Avg_fragmentation_in_percent,avg_page_space_used_in_percent) SELECT object_name(dt.object_id)ObjectName,si.name IndexName, dt.avg_fragmentation_in_percent,dt.avg_page_space_used_in_percent from ( SELECT object_id,index_id,avg_fragmentation_in_percent,avg_page_space_used_in_percent FROM sys.dm_db_index_physical_stats(DB_ID(),NULL,NULL,NULL,’DETAILED’) where index_id<>0 )dt INNER JOIN sys.indexes si ON si.object_id=dt.object_id and si.index_id=dt.index_id Order By dt.avg_fragmentation_in_percent asc SELECT * FROM @IndexFrag where ObjectName=’__DROPRO’ order by ObjectIndex
|
As u can see the empty table doesn’t have fragmentation and no data pages associated with it.
I have done few hundreds of transaction on the table with insert, update and delete.

Checking fragmentation after the transactions
SELECT id,indid,dpages,OrigFillFactor,name Ind_Name FROM sys.sysindexes
WHERE id=OBJECT_ID(‘__DROPRO’)
| id | Indid | dpages | OrigFillFactor | Ind_Name |
| 518565927 | 1 | 666 | 0 | Colid_Clu |
| 518565927 | 2 | 554 | 0 | NonClustered_CheckFrag |

DBCC SHOWCONTIG(‘__DROPRO’)
DBCC SHOWCONTIG scanning ‘__DROPRO’ table…
Table: ‘__DROPRO’ (518565927); index ID: 1, database ID: 7
TABLE level scan performed.
– Pages Scanned…………………………..: 666
– Extents Scanned…………………………: 89
– Extent Switches…………………………: 347
– Avg. Pages per Extent……………………: 7.5
– Scan Density [Best Count:Actual Count]…….: 24.14% [84:348]
– Logical Scan Fragmentation ………………: 99.85%
– Extent Scan Fragmentation ……………….: 66.29%
– Avg. Bytes Free per Page…………………: 2336.0
– Avg. Page Density (full)…………………: 71.14%
DBCC execution completed. If DBCC printed error messages, contact your system administrator.

Avg_fragmentation_in_percent has increased above 15 %( A value between 5-30% indicates moderate fragmentation, while any value over 30% indicates high fragmentation) it means the physical order of the index pages is not matching with the logical order.
The Avg_page_space_used_in_percent is another value that it is worth to look closely. This value represents the amount of spaced used in the indexes. A value below 75% is usually associated to internal fragmentation.
| Reference Values (in %) | Action | SQL statement |
| Avg_fragmentation_in_percent > 5 AND < 30 | Reorganize Index | ALTER INDEX REORGANIZE |
| Avg_fragmentation_in_percent > 30 | Rebuild Index | ALTER INDEX REBUILD |
As we can see the Avg_fragmentation_in_percentage is more than 30% we will go for Rebuilding of indexes
USE [vcvcxvcx]
GO
ALTER INDEX [Colid_Clu] ON [dbo].[__DROPRO] REBUILD PARTITION = ALL
WITH
(
PAD_INDEX = OFF, STATISTICS_NORECOMPUTE = OFF, ALLOW_ROW_LOCKS = ON,
ALLOW_PAGE_LOCKS = ON, ONLINE = ON, SORT_IN_TEMPDB = OFF
)
GO
Check Running Jobs Status
I am not sure how many DBA are really interested to know, is there a way to get all running jobs status and other information from Query Analyzer.
I got to know this when I have to monitor more than 100+ jobs. I really have to put great effort to know what all jobs are running at a time and much more
| USE msdb
GO exec sp_get_composite_job_info @execution_status=1 GO |
Other parameter for @execution_status
| @execution_status =
0 = Not idle or suspended, 1 = Executing, 2 = Waiting For Thread, 3 = Between Retries, 4 = Idle, 5 = Suspended, 6 = WaitingForStepToFinish, |
